Red Flag Fire Weather Warnings: A Complete Guide to Fire Weather Forecasts

Every fire investigator knows that weather conditions drive wildfire behavior. But the challenge is in understanding what fire weather alerts really tell you. A red flag fire weather warning might set off alarms for the public, but for investigators and fire management professionals, it's a critical directive and a cue to look closer at atmospheric conditions that create extreme fire danger.
This article breaks down the core components of fire weather forecasting beyond just temperature and humidity. You'll learn how to interpret Red Flag Fire Weather Warnings, the Haines Index, Ventilation Index, fuel moisture levels, and more. And more importantly, how to apply that fire weather intelligence to real-world fire investigations, wildfire suppression analysis, and legal documentation.
Table of Contents
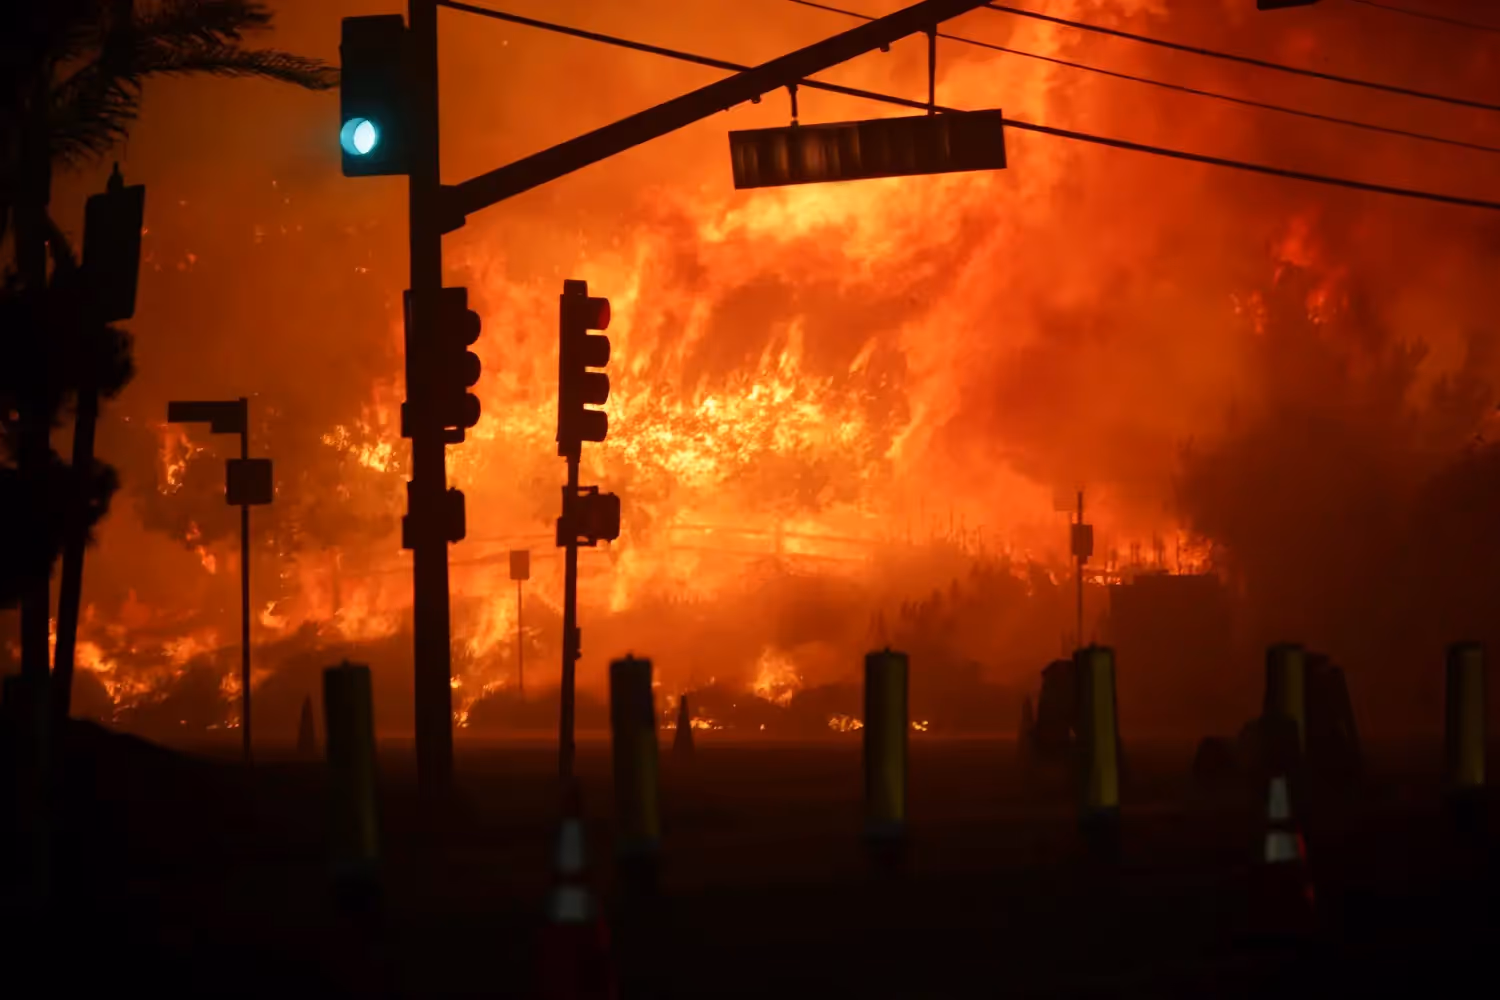
At first glance, a red flag fire weather warning seems self-explanatory. But what exactly does it trigger? These critical fire weather alerts are issued by the National Weather Service (NWS) when atmospheric conditions and fuel moisture create a perfect storm for extreme fire behavior that becomes nearly impossible to control.
A red flag warning signals that any wildfire ignitions during the warning period can spread rapidly, develop multiple fire fronts, and generate dangerous spotting activity ahead of the main fire perimeter.
Criteria for a Red Flag Fire Weather Warning:
The National Weather Service issues red flag warnings when specific weather criteria are met:
- Sustained winds ≥ 25 mph
- Relative humidity < 15%
- High ERC (Energy Release Component) or dry fuel loads
- Duration of dangerous fire weather conditions lasting several hours or more
- Low fuel moisture percentages across multiple timelag classes
You'll often see red flag fire weather warnings tied to Fire Weather Watches. A Fire Weather Watch means critical fire weather conditions are possible in the next 24-72 hours, while a red flag warning means those dangerous conditions are imminent or already occurring.
Once a red flag warning is issued, fire restrictions may include halting prescribed burns, closing public lands, implementing burn bans, or suspending equipment use that could create sparks. Wildfires ignited during red flag fire weather warning periods often exhibit extreme fire behavior with multiple fire heads, long-range spotting, and high rates of spread.
Always log the timing of red flag warnings, especially if ignition occurred during or just before the warning window. This documentation can influence legal culpability, negligence claims, wildfire suppression resource allocation decisions, and demonstrate whether appropriate fire weather precautions were taken.
The Haines Index measures atmospheric instability and low-level moisture—essentially, how likely the fire weather conditions are to help a wildfire go vertical and develop a strong convection column. Fires with strong vertical motion and atmospheric instability are harder to contain and more likely to generate pyrocumulus clouds, spot fires ahead of the main front, and rapid upslope fire runs.
The Haines Index is derived from temperature and dew point differences at two mid- and upper-level atmospheric elevations. A Haines Index of "6" doesn't mean a wildfire will start, it means that if ignition occurs under those fire weather conditions, the fire will escalate quickly with dangerous fire behavior.
Wildfires burning during periods with a Haines Index of 5–6 often show erratic fire runs, column-driven spotting activity, and rapid crown fire transitions. Fire investigators can cross-reference the Haines Index with burn pattern symmetry and crown fire evidence to build an accurate wildfire spread narrative and fire behavior timeline.
Fuel moisture is the bridge between fire weather forecasts and actual flame propagation. You can have all the wind and heat in the world, but if the fuels aren't sufficiently dry, ignition is difficult and sustained fire spread is unlikely. On the flip side, when fuel moisture dips below critical thresholds during red flag conditions, even a single spark can trigger a rapidly spreading wildfire.
This fire weather metric tells you how primed the landscape is for ignition and sustained burning. Yet it's often the most underutilized data point by new fire investigators and even seasoned field personnel. Whether you're modeling fire spread rates or assessing burn severity post-incident, knowing the fuel moisture profile across different fuel timelag classes is non-negotiable.
Categories of Fuel Moisture:
- 1-hour fuels: Fine grasses, pine needles, and light brush that ignite quickly and react almost instantly to relative humidity swings and fire weather changes
- 10-hour fuels: Small sticks, twigs, and light branches that carry active fire spread across the landscape and respond to daily weather patterns
- 100-hour fuels: Larger branches and small logs that burn slower but sustain active firelines and respond to weekly fire weather trends
- 1,000-hour fuels: Large logs, downed timber, and heavy dead fuels that fuel long-duration smoldering combustion, deep-burning fires, and respond to seasonal drought patterns
Fuel moisture is measured via RAWS (Remote Automated Weather Stations) and often expressed in percentile values relative to historical climate data. A 1,000-hour fuel moisture at or below 10%? That’s the kindling for an unstoppable fire, even without flashy winds or high temperatures.
Always cross-reference modeled fuel moisture with what you actually observe on-scene. Complete consumption of heavy fuels in shaded canyons or north-facing slopes late in the season is a tactical red flag. It may signal prolonged drought conditions, exceptionally low fuel moisture, or even deliberate ignition under unusually dry conditions.
We talk about the Fire Behavior Triangle, weather, fuel, and topography, but wind and slope often drive the most surprising spread patterns.
- Wind: Directs fire movement and spread direction, increases oxygen supply to the combustion zone, pre-heats fuels ahead of the flame front, causes long-range ember spotting and spot fire ignitions
- Slope: Fires move exponentially faster uphill due to radiant heat preheating of upslope fuels, with fire spread rates potentially doubling for every 10-degree increase in slope angle
- Aspect: South- and west-facing slopes dry out faster due to solar radiation, creating lower fuel moisture and higher fire danger during red flag conditions
Even with calm surface winds, thermal updrafts or localized gusts can cause flame lengths to double and fire to “run” unexpectedly — it's one of the reasons wildland firefighters train extensively on fire behavior before ever touching a handline.
If there are sudden shifts in fire direction during your reconstruction, check wind shift logs and ridge orientation. The final shape of the burn scar often mirrors topographic constraints—canyon systems, ridge lines, fuel breaks—more than initial ignition patterns, especially during extended red flag fire weather warning periods.
Used more commonly in smoke management and prescribed fire planning, the Ventilation Index measures how well smoke and particulates disperse into the atmosphere during fire events. This fire weather parameter becomes critically important during red flag conditions when multiple wildfires may be burning simultaneously.
Combined with the Mixing Height (the atmospheric elevation to which smoke can rise) and Transport Winds (winds aloft that carry smoke horizontally), the Ventilation Index helps predict smoke drift patterns, air quality impacts, and visibility hazards during fire weather events.
Firefighter entrapments and visibility-related accidents often align with low mixing heights and poor ventilation conditions during wildfires. Documenting these fire weather parameters can add significant weight to incident reports, legal proceedings, and after-action reviews.
Forecasts aren’t gospel but guidance. But when you know how to use them right, they become one of the most powerful tools in your investigative arsenal. Whether you’re reconstructing a fire’s timeline, assessing red flag fire weather warning impacts or flagging future risk, you need more than just temperature and wind. You need granular, localized, and time-stamped data to draw accurate conclusions.
Here’s a breakdown of the most essential fire weather tools for investigators, what they offer, and how to use them effectively:
Always compare forecasted fire weather conditions vs. observed conditions. Did the fire spread faster than expected? Were RH levels lower than modeled? Did terrain channel winds in a way the model didn’t predict?
Many of the most devastating wildfires have outpaced their fire weather forecasts because real-world terrain interactions, wildland-urban interface effects, and shifting fuel loads exceeded what atmospheric models anticipated. Your job as an investigator is to test fire weather predictions relentlessly against what happened on the ground during the red flag warning period.
Weather is the narrative thread that connects ignition, spread, and suppression. As a fire investigator, your ability to decode atmospheric signals separates a surface-level report from a courtroom-ready one.
Here’s what you should walk away with:
Here’s what you should walk away with:
- Red Flag Fire Weather Warnings are operational triggers that affect liability, suppression decisions, and ignition risk thresholds. Document when warnings were issued relative to fire ignition.
- The Haines Index points to the vertical energy of a fire. High Haines days mean more plume-driven behavior, faster escalation, and harder-to-predict runs.
- Fuel moisture determines what’s ready to burn. If you’re not using percentile data from RAWS, you’re missing half the ignition equation.
- Slope and wind alignment explain why a fire moved the way it did. They’re not “environmental factors” but cause-and-effect accelerants.
- The Ventilation Index gives you critical insight into smoke dispersion, visibility issues, and air quality hazards, which is especially relevant for public health impacts and smoke drift liability during extended red flag fire weather warning periods.
Here’s what to do next:
- Make it a habit to archive the day’s fire weather forecast when deploying or investigating.
- Pull RAWS data and compare it with actual burn behavior. Was it consistent? If not, document the anomaly.
- Reference spot forecasts and Haines Index values in your reports. It strengthens your timeline, supports your spread hypothesis, and provides scientific context for courtroom testimony.
- Build your own forecasting cheat sheet. Know where to go for live data, historical archives, and terrain-specific models.
You can’t always say who lit the match. But if you can map how the fire moved, why it moved that way, what fire weather signals were present, and what signals were missed, you’ll uncover truths that matter just as much —and sometimes more—than ignition source determination alone.
Understanding fire weather forecasts, particularly red flag fire weather warnings, is essential for fire investigators, wildland firefighters, fire management officers, and anyone involved in wildfire prevention and suppression. By learning to interpret these critical fire weather alerts and atmospheric indicators, you can better anticipate extreme fire behavior, document fire weather conditions for legal proceedings, and ultimately improve wildfire response and public safety outcomes.


Trusted by Public and Private Investigator Teams Everywhere
Whether you're a big state agency, a small local fire department or somewhere in between, Blazestack software (NFPA 921® & CJIS compliant) collects fire scene data and generates standardized origin and cause reports in a fraction of the time of other methods.
To learn more about Blazestack, give us a call at (866) 303-4344 or email us at support@blazestack.com
Get Your Free 14-Day Trial and Custom Price Quote Now
We'll let Blazestack do the talking. Try it out right now for free.
A member of our staff will be in touch shortly.